|
Real Estate Market Analysis Reports
East verses West
Fraser Valley -Vancouver
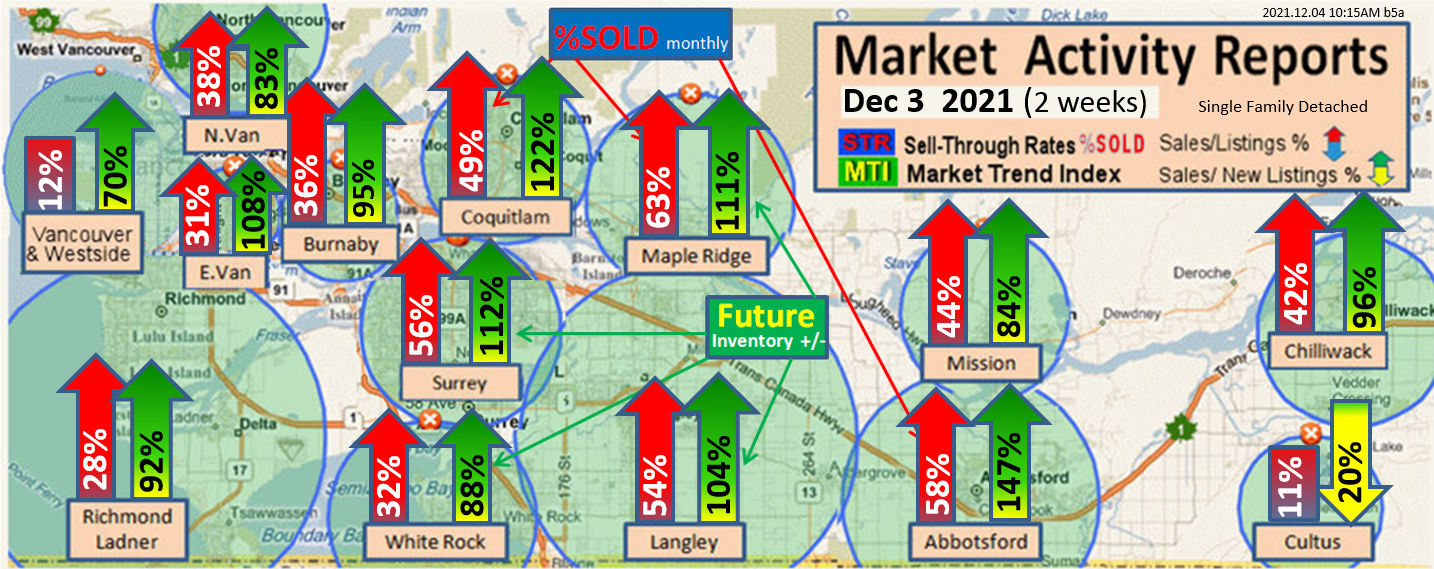
Market Trend Index
New Sales versus New Listings Ratios
Detached Homes
East (Fraser Valley Surrey-Abbotsford) vrs West (Richmond-White Rock)
March 3 2011 w8c
Evaluating the real estate market can be done by three different methods: past, current and the future.
History Evaluation: Like most appraisers, one studies the sales data from the previous month and evaluates the sales volume and the under or over supply of listings. This supply and demand review usually provides 2020 hindsight clarity as to what happened.
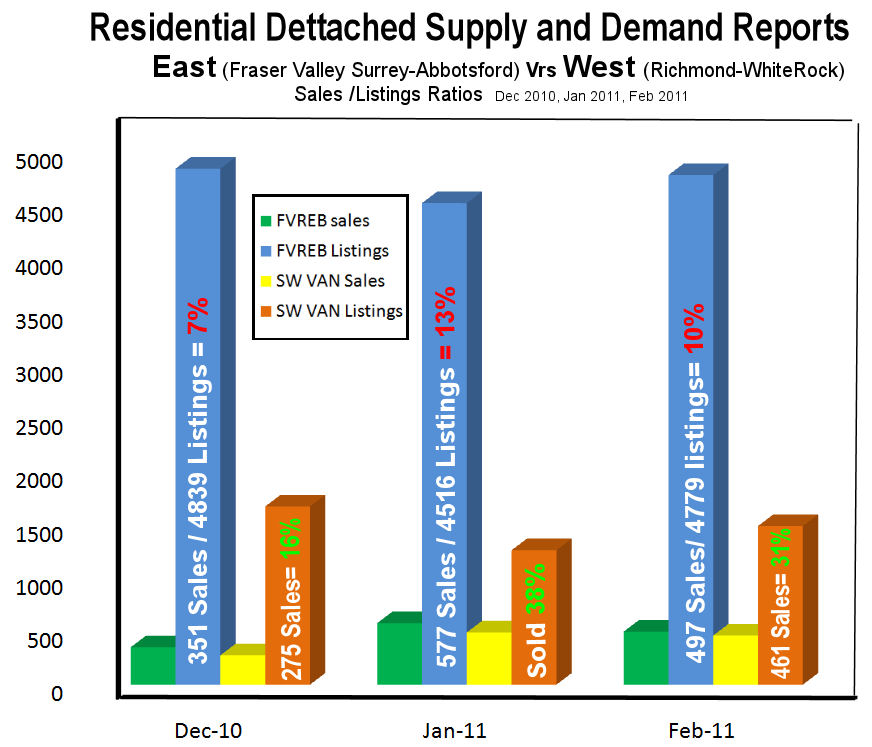
Current Market Evaluation: Here one can study the current supply and demand levels and determine the pressure that is on the market. Traditionally in residential real estate in the Abbotsford area, we find that 23% of the listings selling each month creates a stable marketplace. Recently, where many months have been single-digit sell-through, this stabilization baseline may be reduced to around 14%.
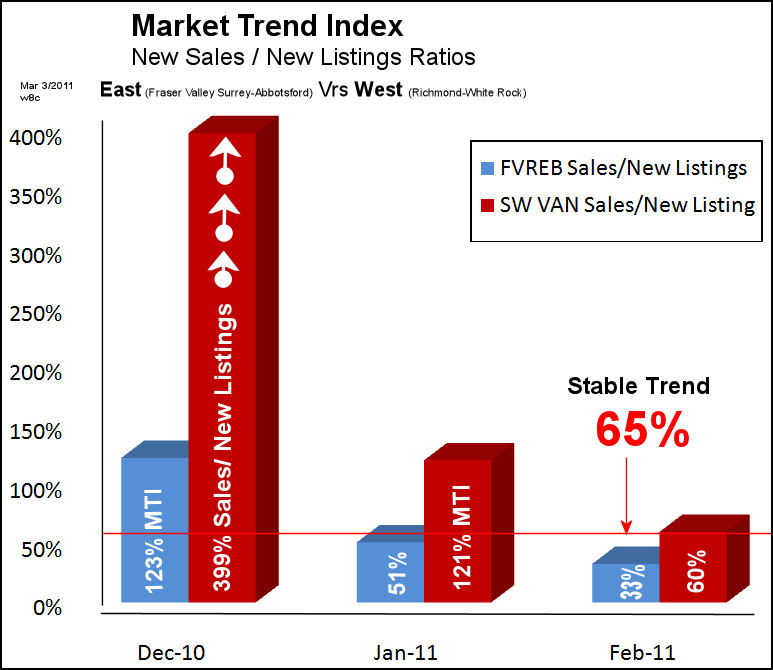
Market Trend Index: 2-3 month forecasts are possible by studying new listings versus the new sales ratios to the upcoming inventory levels and understand supply and demand based on this trend studying the new listings versus the new sales ratios. History has shown that we need about 65% of the new listings to sell in a given month in order to have market stability.
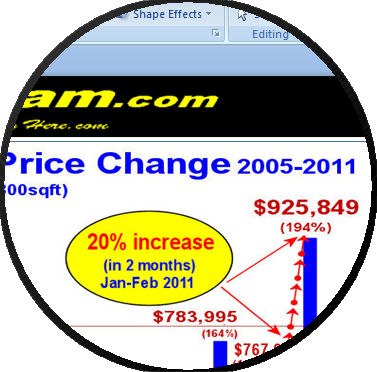
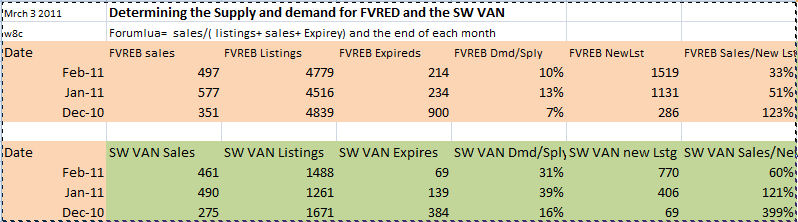
In evaluating the Richmond White Rock corridor that has had the onslaught of mainland Chinese investors, we see that in December in our study of the market area of residential detached homes there were 69 new listings in the Richmond area with 275 sales equaling 399% of the new listings selling: as you can see there were four times as many buyers that bought than those that actually listed and it is an easy projection to see that the prices will have extreme pressure in the next several months. The month of January had 406 listings but still 460 sales resulting in 120% sell-through. As of March 3 the listings and the sales ratios have a 60% MTI. Under normal circumstances this would result in a stable market. With today's frenzy and high emotion this is too difficult to project.
The Fraser Valley MTI evaluation shows us they have experienced the opposite, whereby January was that 50%, 51% which is stable market trend Index. But for the month of February the Fraser Valley had 1519 new listings with only 497 sales thus dropping the MTI to 32% and putting downward pressure on the market.
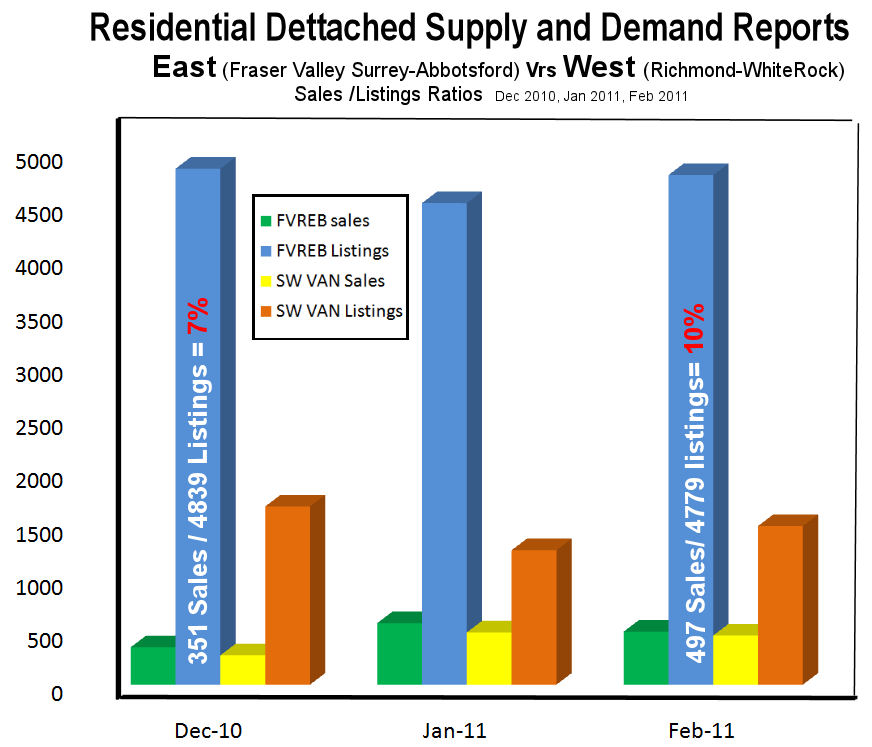
Now look at the supply and demand for the Richmond Corridor with the Sales in Yellow and the Listings in Orange. Firstly you should notice that in January 2011 the Richmond Corridor had 490 sales, almost as many as the 577 sales in the entire FVREB with its near 5,000 listings. So Richmond, at 39% sell-through, is very strong going up at $10,000 per month and the Fraser Valley with its 13 % sell through is below the stable market of 14% and could be dropping $1,000 per month.
For the month of February we can see that the listing inventory has come up to reduce the Sales Demand/Supply ratios which dropped to 31% which is still well beyond the 23% that brings market stability, so resulting in a continued a strong upward market .
The Fraser Valley's February sell-through is now reduced to well below the market stability line so it sees continued downward pressure. The knowledge of the high emotion fast paced Richmond market will askew the normal indices market indicators in the Fraser Valley and prevent confident market projection. Bottom line, many local vendors in the Fraser Valley will be dreaming to get some of the Chinese money for their own high sale price and may resist marketing at current market evaluations.
This is the Big Secret Weapon forecaster: In December Richmond had a 400% MTI, 4 times the sales over new listings. The writing was on the wall and it is a reasonable project to see a very strong market in Jan and Feb.
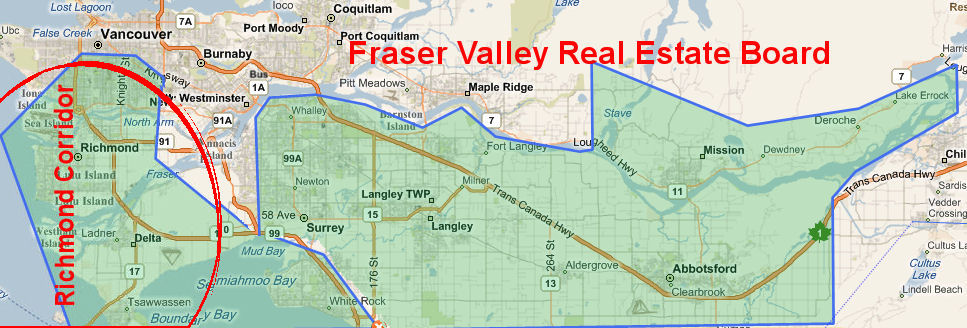
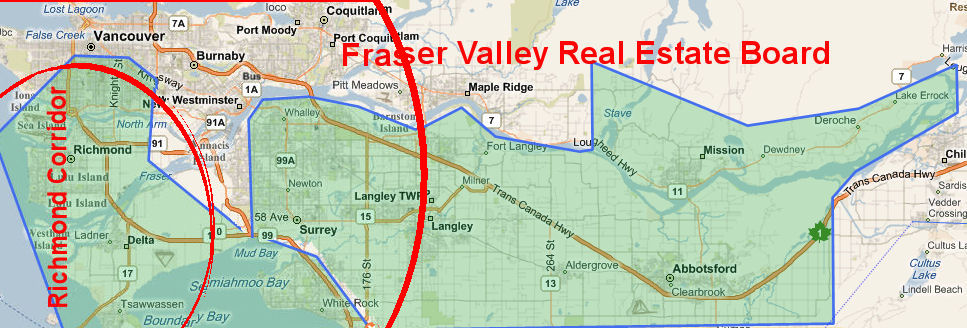
Map of the wave of new Chinese Money
|
Mrch 3 2011 |
Determining the Supply and demand for FVRED and the SW VAN |
|
|
|
w8c |
Forumlua= sales/( listings+ sales+ Expirey) and the end of each month |
|
|
|
Date |
FVREB sales |
FVREB Listings |
FVREB Expireds |
FVREB Dmd/Sply |
FVREB NewLst |
FVREB Sales/New Lstngs |
|
Feb-11 |
497 |
4779 |
214 |
10% |
1519 |
33% |
|
Jan-11 |
577 |
4516 |
234 |
13% |
1131 |
51% |
|
Dec-10 |
351 |
4839 |
900 |
7% |
286 |
123% |
|
|
|
|
|
|
|
|
|
Date |
SW VAN Sales |
SW VAN Listings |
SW VAN Expires |
SW VAN Dmd/Sply |
SW VAN new Lstg |
SW VAN Sales/NewLstng |
|
Feb-11 |
461 |
1488 |
69 |
31% |
770 |
60% |
|
Jan-11 |
490 |
1261 |
139 |
39% |
406 |
121% |
|
Dec-10 |
275 |
1671 |
384 |
16% |
69 |
399% |
|